Published online this week, the EPO Administrative Council has now made available the annual compendium of statistics on activity at the EPO and member state offices in 2020. The report provides a more in depth overview of patent figures compared to the EPO Patent Index, including detailed breakdown of EPO Opposition figures.
EPO Opposition highlights include:
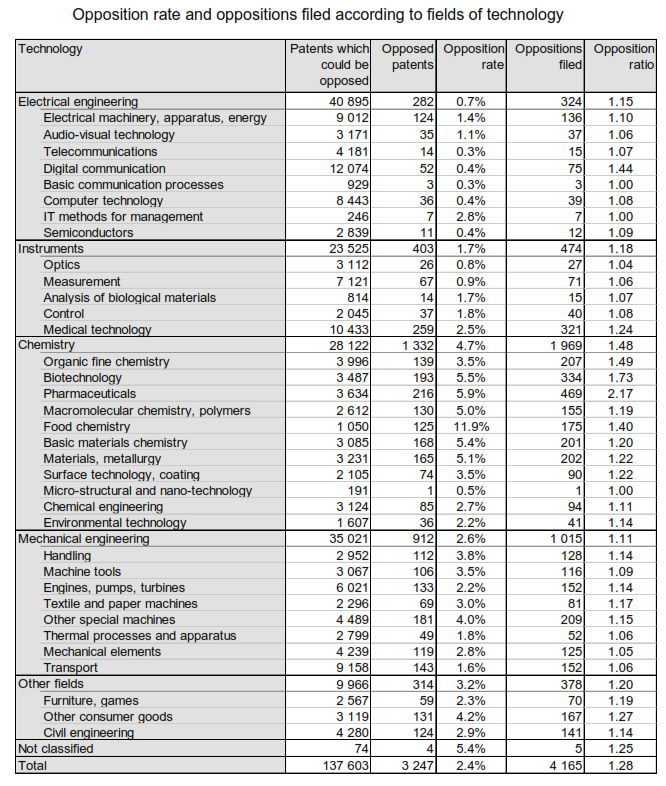
- 2.4% of patents for which the opposition period expired in 2020 were opposed (2.7% in 2019)
- average of 1.28 oppositions filed per opposed patent (1.22 in 2019)
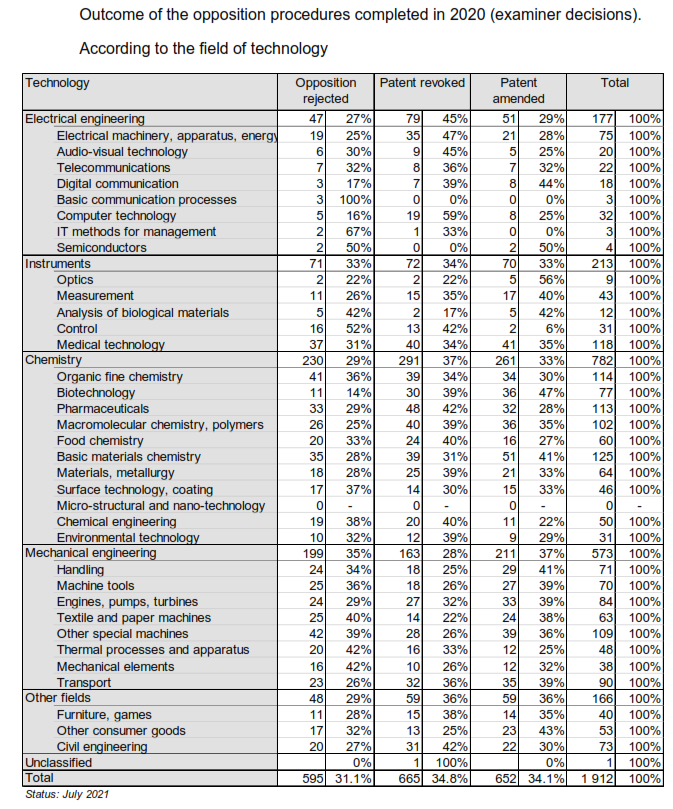
- 31.1% of oppositions rejected, 34.1% of patents maintained in amended form, 34.8% of patents revoked (29% in 2019)
- 15.4 months mean duration of opposition proceedings (from expiry of opposition filing period to date of opposition decision) for standard opposition cases (excluding cases with more than one opponent, participation of a legal member or re-scheduling of oral proceedings) (17.5 months in 2019)
- Chemistry (total 1332 patents opposed), and in particular Pharmaceuticals had the largest number of patents opposed (216)
- Food Chemistry had the highest opposition rate (11.9%)
- Telecommunications (and Basic Communication Processes) had the lowest opposition rate (0.3%)
- Computer Technology (59%), Electrical Machinery, Apparatus, Energy (47%), Audio-Visual Technology (45%) and Pharmaceuticals (42%) had the highest revocation rates
- Basic Communication Processes (0%) and Semiconductors (0%), Analysis of Biological Materials (17%) and Textile and Paper Machines (22%) had the lowest revocation rates
The full set of opposition rates and outcomes in each field of technology are reproduced below:
Further information, and the full report can be found here
Published earlier this year, the EPO Board of Appeal annual report on statistics for 2020 can be found here
