The EPO Administrative Council has now made available the annual compendium of statistics on activity at the EPO and member state offices in 2022. The report provides a more in depth overview of patent figures compared to the EPO Annual Review, including detailed breakdown of EPO Opposition figures.
EPO Opposition highlights include:
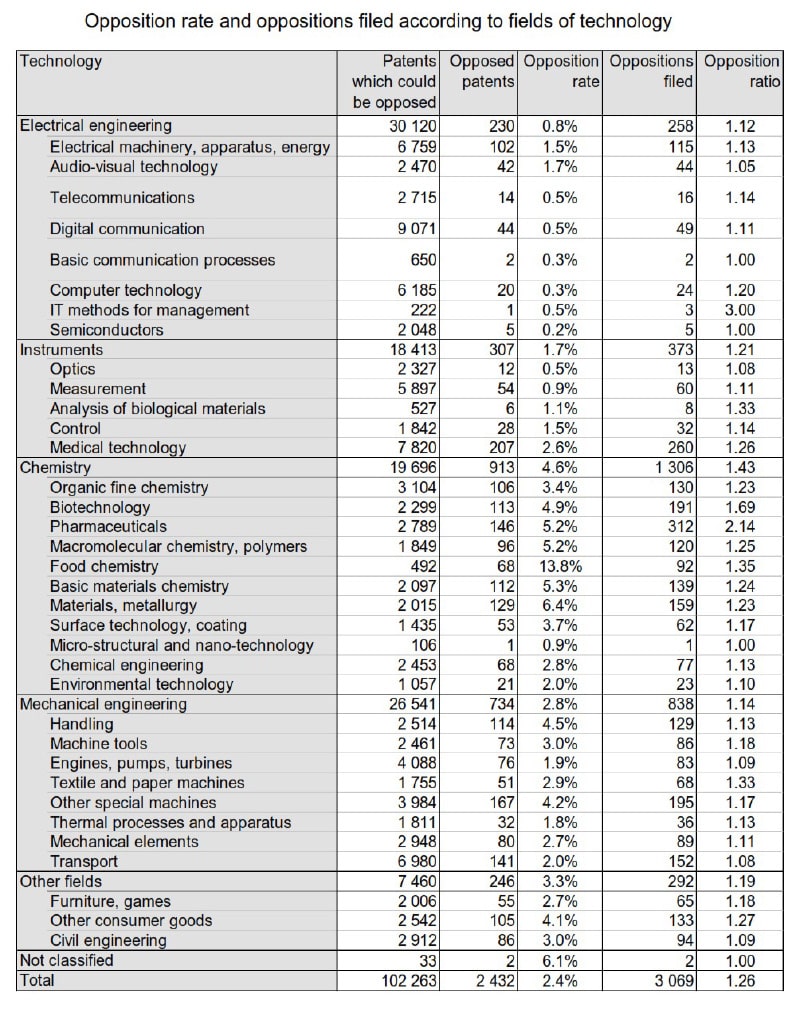
- 2.4% of patents for which the opposition period expired in 2022 were opposed (2.5% in 2021)
- average of 1.26 oppositions filed per opposed patent (1.25 in 2021)
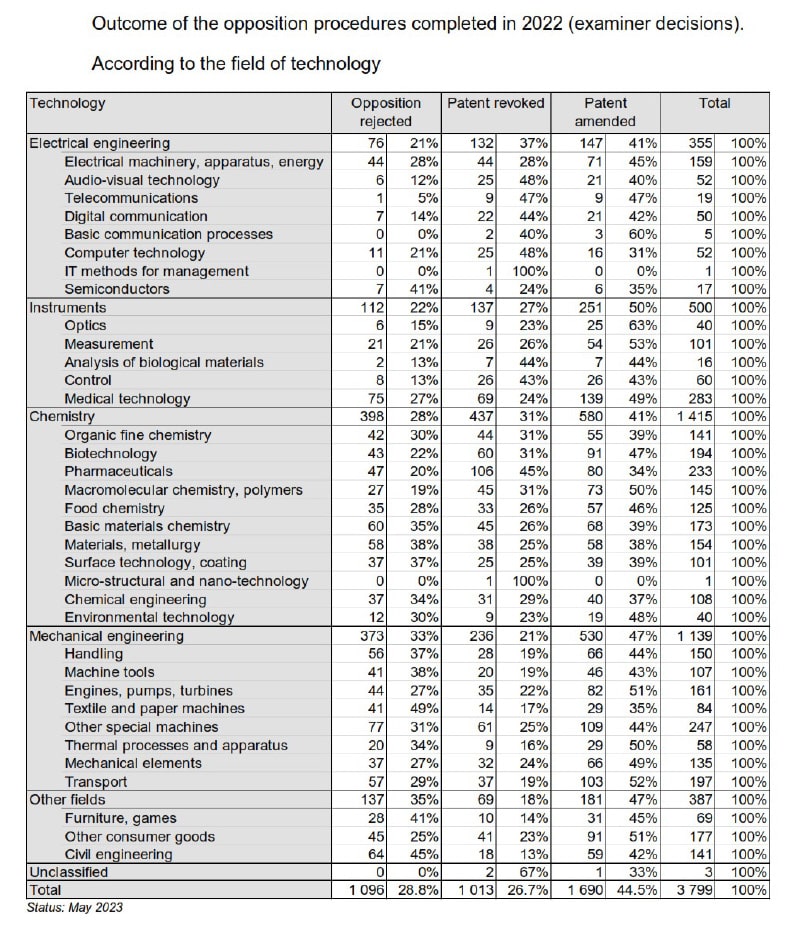
- 29% of oppositions rejected, 44% of patents maintained in amended form, 27% of patents revoked (26% in 2020)
- 19.6 months mean duration of opposition proceedings (from expiry of opposition filing period to date of opposition decision) for standard opposition cases (excluding cases with more than one opponent, participation of a legal member or re-scheduling of oral proceedings) (19.3 months in 2021)
- Chemistry (total 913 patents opposed), and in particular Pharmaceuticals had the largest number of oppositions filed (312)
- The sub-field with most patents opposed was “Medical Technology” (207) in Instruments
- Food Chemistry had the highest opposition rate (13.8%)
- Electrical Engineering (0.8%), in particular Semiconductors (0.2%), Computer Technology (0.3%), Basic Communication Processes (0.3%), Telecommunications (0.5%), Digital Communications (0.5%) and IT Methods of Management (0.5%) had the lowest opposition rates
- For fields where more than 10 oppositions were filed, Audio-Visual Technology (48%), Computer Technology (48%), Telecommunications (47%), and Pharmaceuticals (45%) had the highest revocation rates
- Oppositions were rejected most in Textile and Paper Machines (49%), Civil Engineering (45%), Furniture and Games (41%) and Semiconductors (41%)
The full set of opposition rates and outcomes in each field of technology are reproduced below:
Further information, and the full report can be found here
